I Ran 8 Microservices Locally With One Command — Here's What I Learned

Spring PetClinic is a distributed system — eight Spring Boot microservices, a service registry, an API gateway, and a full observability stack. Here's what running it locally with Docker Compose teaches you that the cloud deployment doesn't.
What Is Spring PetClinic?
Spring PetClinic is a reference application maintained by the Spring team. It's a distributed system — eight Spring Boot microservices, each with its own database, communicating through a service registry, sitting behind an API gateway, with a full observability stack. It's the kind of architecture you'd find in a real production system.
My DMI cohort deployed it to AWS EKS. This post is about running it locally with Docker Compose — and what that teaches you that the cloud deployment doesn't.
Prerequisites
You need two things:
- Docker Desktop (docker.com/products/docker-desktop)
- Git
That's it. Java, Maven, AWS credentials — none of it. The images are pre-built on Docker Hub.
Step 1: Clone the Repo
git clone https://github.com/sqenchill/spring-petclinic-microservices.git
cd spring-petclinic-microservices
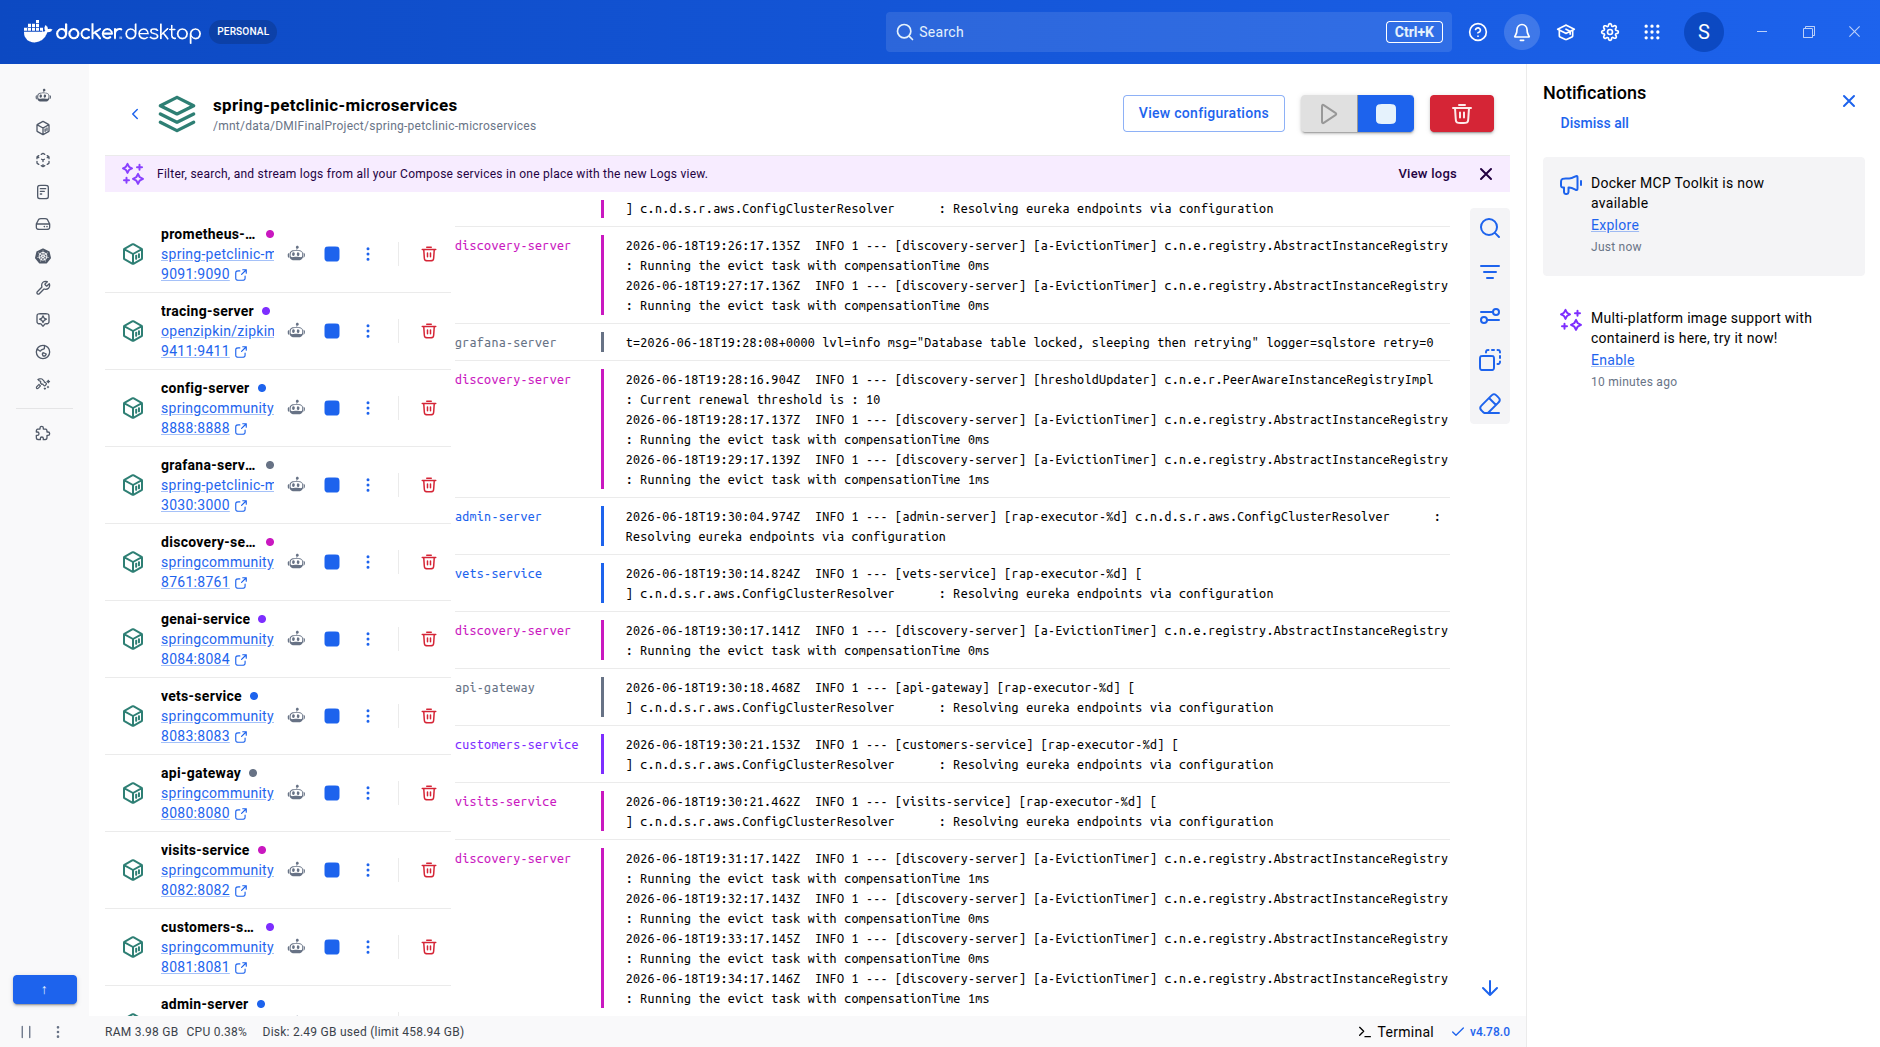
The repo contains a docker-compose.yml that defines all 11 containers — 8 application services plus Prometheus, Grafana, and Zipkin.
Step 2: Start Everything
docker compose up -d
That's the command. Docker pulls the images and starts the containers in dependency order.
Expect this to take 3–5 minutes on the first run while images download. On subsequent runs it starts in under a minute.
The Startup Order — Why It Matters
This is the most important thing to understand about this application.
Config Server must start first. It serves YAML configuration to every other service from a Git repository. Without it, no service can load its settings.
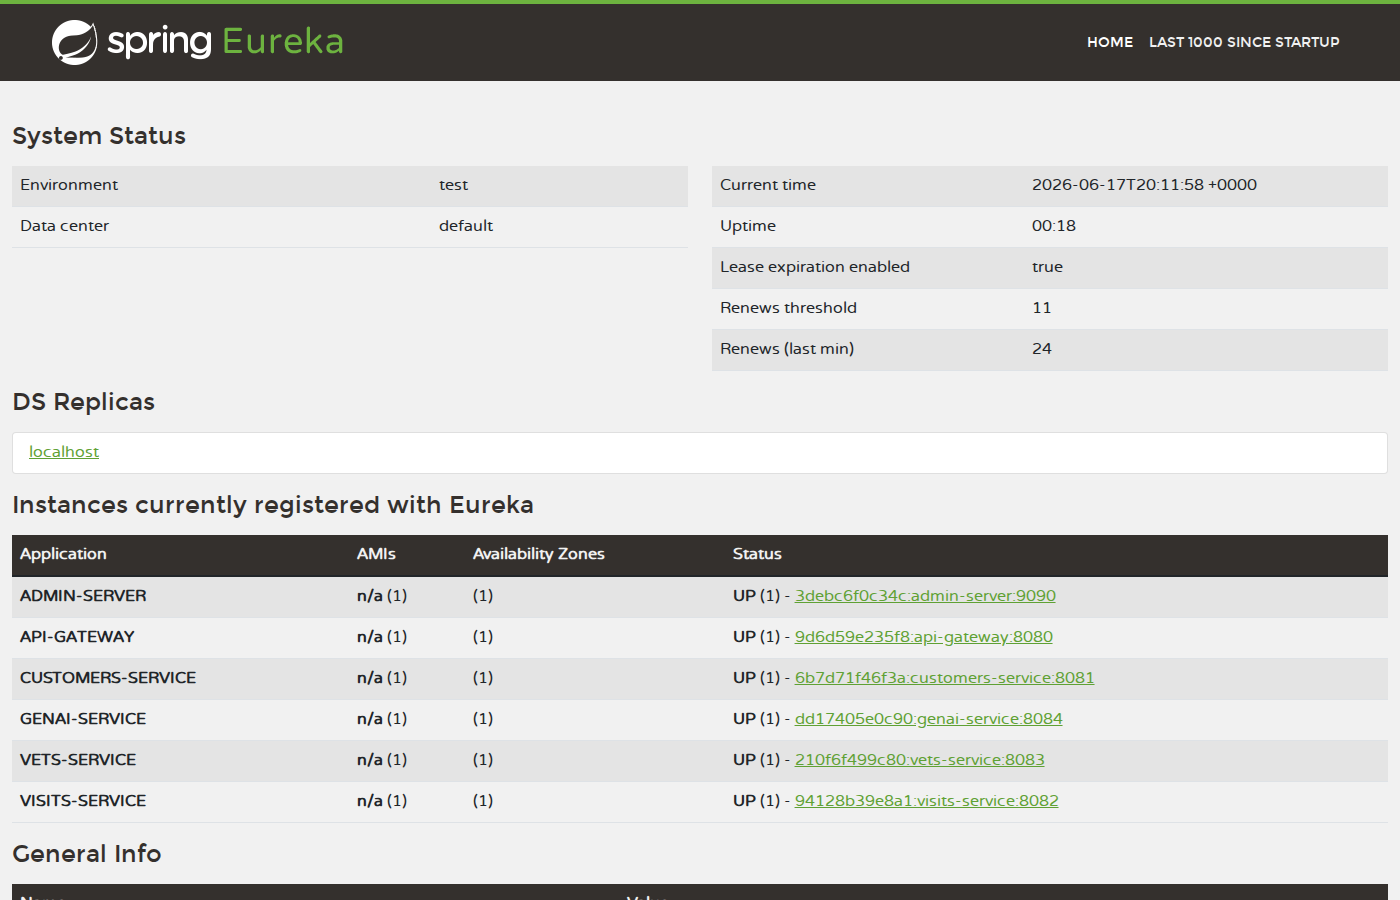
Discovery Server (Eureka) must start second. It's the service registry — services find each other by name through Eureka, not by hardcoded IP addresses. Without it, no service can register or locate another.
Every other service depends on both of these being healthy before it starts.
The docker-compose.yml enforces this with depends_on and health checks. Each service definition specifies that it requires config-server and discovery-server to be in a healthy state before its container starts. Docker Compose polls the health endpoints and holds the dependent container until the condition is met.
This is why you can't just start all 8 services simultaneously — the domain services would try to fetch their config, get connection refused from a config-server that isn't ready yet, and crash immediately.
Step 3: Verify the Stack
Once all containers are up, open these URLs:
| Service | URL | What You Should See | |---------|-----|---------------------| | Spring PetClinic App | http://localhost:8080 | Welcome page with navigation | | Eureka Dashboard | http://localhost:8761 | 6 services registered, all UP | | Spring Boot Admin | http://localhost:9090 | All applications green | | Zipkin | http://localhost:9411 | Trace search interface | | Prometheus | http://localhost:9091 | Metrics query interface | | Grafana | http://localhost:3030 | Spring PetClinic Metrics dashboard |
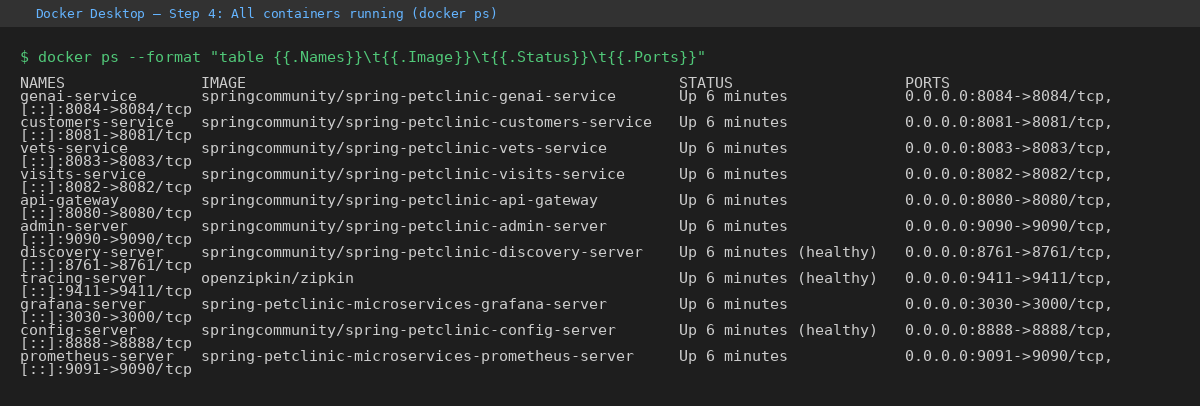
Run docker compose ps to confirm all containers show Up status. config-server, discovery-server, admin-server, and tracing-server should also show (healthy).
Step 4: Test the Application
Navigate to localhost:8080 → Find Owners → Find Owner (no filter). You should see a table of 10 owners.
Click an owner, then click a pet, then click Add Visit. Enter a date and description and submit. The visit should appear immediately in the pet's history — confirming the API gateway routed your request correctly, the visits-service processed it, and the database persisted it.
Go to Veterinarians. The vets table should load with 6 vets and their specialties — data served by the vets-service through the same api-gateway.
Step 5: The Observability Stack
This is where Docker Compose teaches you something the cloud deployment abstracts away.
Prometheus is scraping metrics from all 8 services via their /actuator/prometheus endpoints. Run the query http_server_requests_seconds_count and you'll see time series for every service that has received traffic.
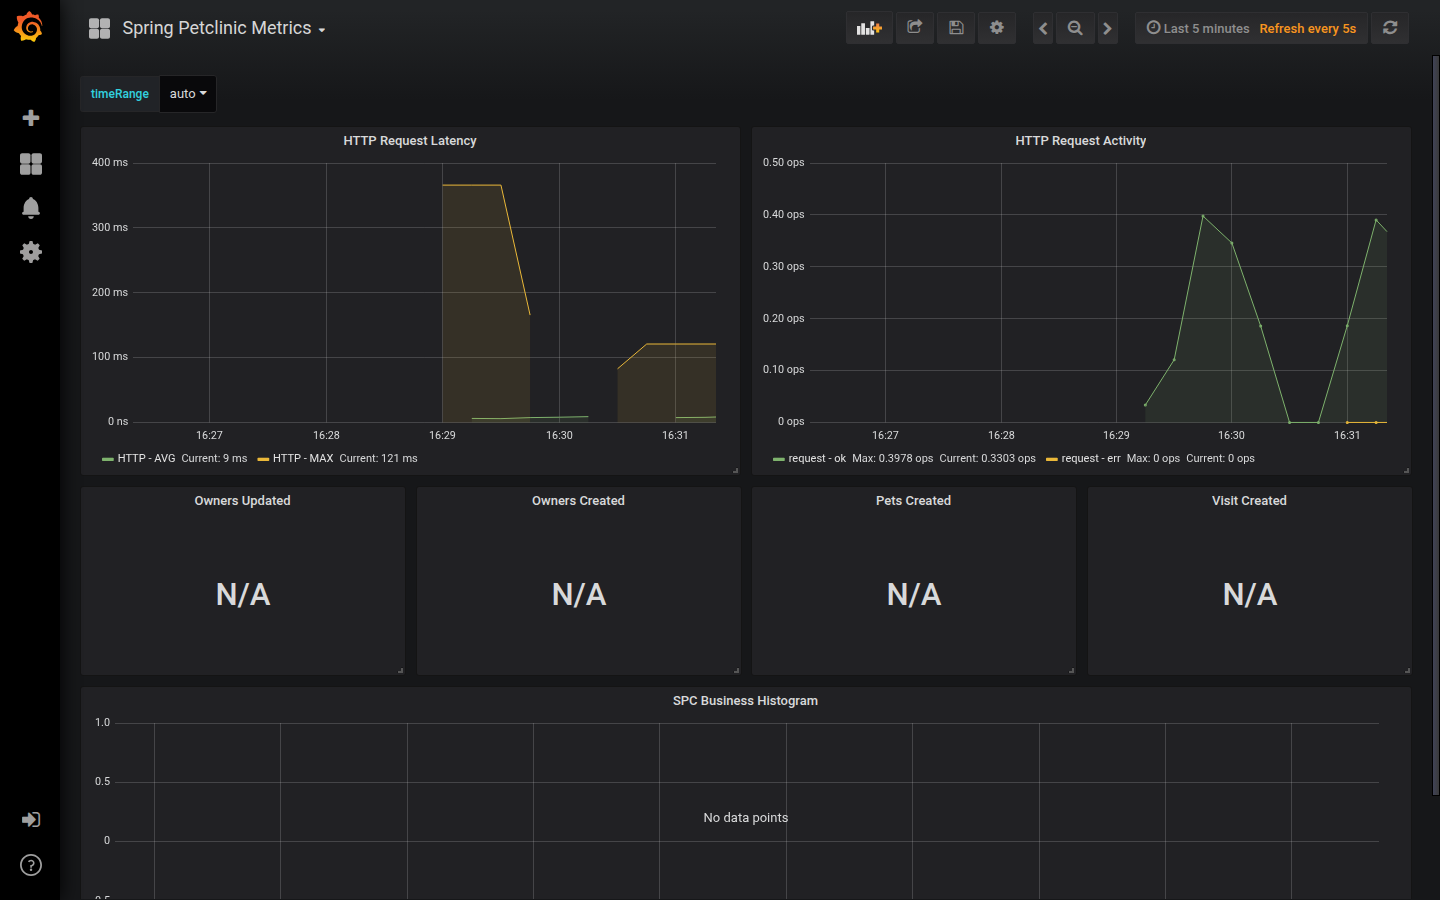
Grafana has a pre-configured Spring PetClinic Metrics dashboard. Once you've browsed the app, open it at localhost:3030 and you'll see HTTP request latency, request rate, and business metrics (owners created, visits created) updating in real time.
Zipkin captures distributed traces. After browsing the owners list, query Zipkin and open a trace. You'll see the full call chain: api-gateway receives the HTTP request, routes it to customers-service, which opens a connection to the database and runs the query. Every hop has a duration — you can see exactly where time is spent.
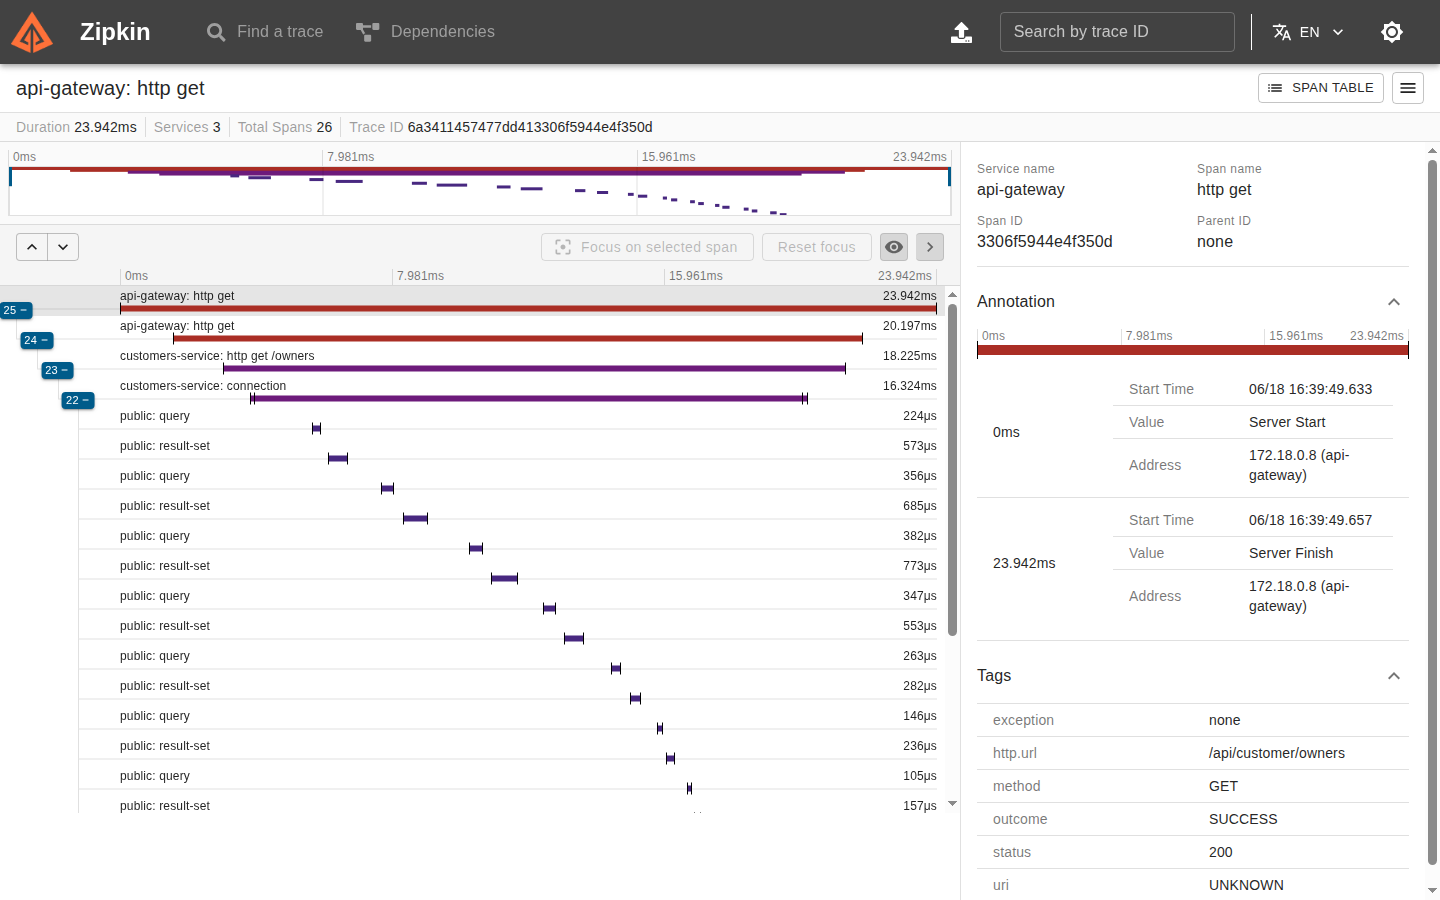
That end-to-end visibility — on a laptop, with one command — is the point of this exercise.
Step 6: Shut Down
docker compose down
All containers stop and are removed. The images stay cached locally. Next time you run up, it starts in seconds.
Key Takeaway
Running this locally made the production architecture concrete in a way that reading about it doesn't. The startup ordering isn't an abstract concept — you can see config-server come up, watch discovery-server wait for it, and then watch the domain services register one by one. The observability stack isn't just a set of tools — you can trace your own request through the system and see the database query at the end.
If you deployed this to EKS and never ran it locally, you missed half the learning.
This is part of DMI (DevOps Micro-Internship). Cohort 3 starts 27 June 2026: https://docs.google.com/forms/d/e/1FAIpQLSel7ai7nyb0P1qLW4vEyfB_nEsD4lUF1XG88vmAaFGBOb6hPA/viewform